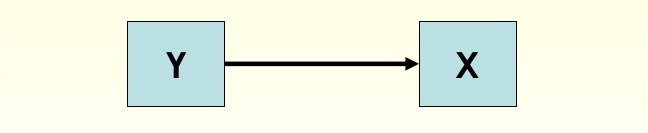
In a functional dependency diagram (FDD), functional dependency is represented by rectangles representing attributes and a heavy arrow showing dependency. Fig. shows A functional dependency diagram for the simplest functional dependency, that is, FD: Y -> X.
In functional dependency diagram, each FD is displayed as a horizontal line.
The left-hand side attributes of the FD, i.e. determinants, are connected by Vertical lines to line representing the FD.
The right-hand side attributes are connected by arrows pointing towards the attibutes.
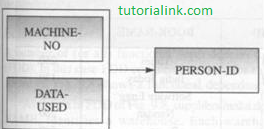
Let us consider a functional dependency that there is one person working on a machine  each day, which is given as:
FD: {MACHINE-NO,DATA-USED} -> {PERSON-ID}
It means that once the values of MACHINE-NO and DATA-USED are known, a unique value
of PERSON-ID also can be known. Fig.(a) shows the functional dependency diagram (FDD)
for this example.
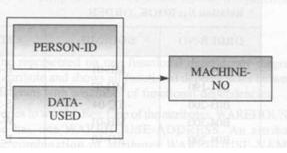
Similarly, in the above example, if the person also uses one machine each day, then FD can be given as:
FD: {PERSON-ID, DATA-USED} -> {MACHINE-NO}
It means that once the values of PERSON-ID and DATA-USED are known, a unique value of MACHINE-NO also can be known. Fig. (b) shows the functional dependency diagram (FDD) for this example
Ask Question